Tuesday, May 14, 2013

Carbon Dioxide: How High Can It Go?

Recently, it was reported that the CO2 (carbon dioxide) level had reached an all time high of 400 ppm (parts per million) on a single day.  It is also believed that by the end of this month of May the average will be around 400 ppm. Where do these readings come from and what do they mean? I will try to answer some questions and relate some websites for further research and reading.

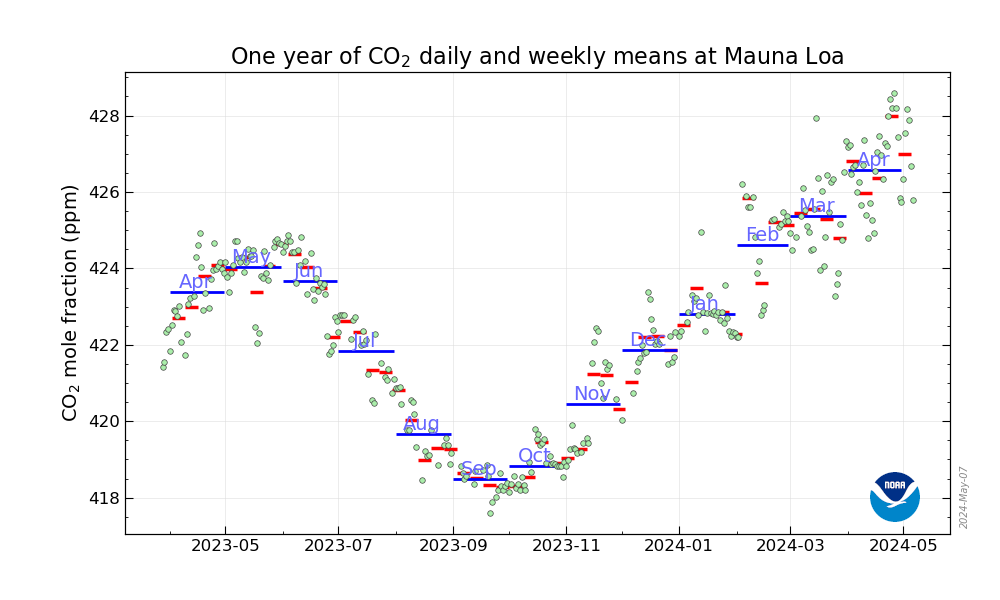
One of the agencies that keeps track of and reports on carbon dioxide levels is NOAA (National Oceanic and Atmospheric Administration). Here is a link to their weekly CO2 report -  Trends in Carbon Dioxide. For the week beginning May 5, 2013 the level is 399.5 which is up 2.5 ppm since last year at the same time and 21.65 ppm from ten years ago. It is important to note that May is usually the highest month for carbon dioxide levels so that generally means that this should be the highest it gets this year. These levels are mostly due to seasonal reasons - spring plants will soon "breathe" in a large portion that builds up over the winter when there is less plant matter.  This photosynthesis and respiration within ecosystems changes the levels of the greenhouse gas CO2 and also the useful, breathable gas, oxygen as it is a product of photosynthesis. On May 13, 2013 there was a single day reading of 400.07 ppm from their facility in Mauna Loa, HI. As you can see from the graph below, the levels of CO2 rise and fall throughout the year.

CO2 Weekly Values for Mauna Loa
Source: NOAA website: Earth System Research Laboratory (Global Monitoring Division)

The NOAA/Mauna Loa website states that they are located "on the north flank of Mauna Loa Volcano, on the Big Island of Hawaii and that due to its remote location in the Pacific Ocean, high altitude (3397 meters, or 11,135 feet above sea level), and great distance from major pollution sources, MLO is a prime spot for sampling the Earth's background air in the well mixed free troposphere."  The website also states that, "The mission of ESRL is to measure atmospheric constituents that are capable of forcing change in the climate of the earth and those that may deplete the ozone layer. ESRL accomplishes this goal primarily through long-term tropospheric measurements of key atmospheric parameters such as carbon dioxide (CO2), carbon monoxide (CO), methane (CH4), chlorofluorocarbons (CFCs), ozone (O3), sulfur dioxide (SO2), nitrous oxide (N2O), radon, aerosols, optical depth, and a spectrum of solar radiation parameters."

Their location is such that sampling is done without as much active (locally centered) pollution adding to the overall mix.  This is important so that the measurement is globally "correct" and not just for the United States or North America. There are sampling stations all over the globe to further support the numbers that are being measured at Mauna Loa Observatory.

What does this mean for us?  It shows a consistent growth of overall CO2 in our atmosphere over the last number of decades and shows a trend.  You will find arguments on all sides of the climate change argument that says this is too high, just right or too low.  The reality is we try to figure out what has happened in the past to trigger major climate changes like ice ages because it would greatly affect the living things on the planet including us. What I believe it does show is that there is a consistent trend showing that CO2 levels are increasing over time. Is this anthropogenic (human-induced)? Yes and no. Some is nature and some is done by humans. Can we affect how all of nature is producing, using and storing CO2 - no.  The only way to reduce greenhouse gas emissions is to control our own production, use and storage.  It is widely known that there are many actions that humans do to produce large amounts of greenhouse gases. We can control our own behavior and it may behoove us to do so sooner than later. The problem with waiting is that there may very well be a tipping point where we adversely affect our environment to the point that it is detrimental to our well-being. 

Monday, April 22, 2013

Earth Day 2013: Stand Up for Your Planet

Here are my favorites for best place to get more information on our trip around the web on Earth Day 2013.  The first stop is National Geographic. Look at some of the best pictures taken of our planet, Take an Earth Day Quiz, learn about its history and see some great green buildings.

photo: Glacier National Park in Montana, Bowman Lake Rainbow Peakphoto: Cannon Beach Haystack Rock, Oregon StateI was able to capture some stunning aerials flying over Nunavik (northern Quebec), Canada
pictures from: national geographic

National Geographic Earth Day 2013


Extreme Green Buildings
Picture of BIQ algae-powered building in Hamburg
This building is partly powered by algae. Yes, algae.

Here is a link to 5Gyres -  5gyres.org  They are studying plastic garbage patches in 5 different gyres including: Gyres in the Indian Ocean, North Atlantic, North Pacific, South Atlantic and South Pacific.

The next stop is the Nature Conservancy.          
Figure out your Carbon Footprint.

The Earthday Network where you can learn about earth day and contribute to their wall of climate change where people are sharing stories of how climate change has affected them.

Even the EPA has a special website with information and activities. EPA

How are you spending your Earth Day this year and how will you affect your own change today? Make the world a better place than what it was for you and future generations will be able to enjoy some of what we get to enjoy everyday.


Monday, April 1, 2013

Samso Island: Self-Sufficient and Carbon Neutral

The cold wind that blows from the North Sea may seem like a negative for some but for the island of Samso in Denmark it has been an economic dynamo. The 4,000 or so inhabitants not only benefit from the wind but also have bought into the plan of using renewable energy literally as they own most of the wind turbines on and around the island.

Samso decided to lessen their dependency on oil and increase their use of renewable energy.  They use wind (on and offshore), solar, biomass, and biofuels.  They now produce more energy than they consume and are selling the excess to surrounding areas.  They are even starting their own Energy Institute to show others how to become more energy independent.
Great Infographic from ngpowereu.com


They are now considered a carbon neutral island or they have a net zero carbon footprint. The only area that residents say they could improve is by increasing the amount of electric vehicles used on the island. They are currently trying to increase their tourism by adding a hotel and a fleet of electric vehicles.  Other places have adopted using all electric vehicles to cut down on the carbon dioxide emitted by fossil fuels. 

One of these is Zermatt, Switzerland who is trying to cut down on the negative impacts to their city and the surrounding environment caused by combustion engine vehicles. Most of their income is dependent on the natural beauty and use of their environment for skiing, hiking and other tourist activities.  They declared that only electric cars and other non-combustion engines that do not emit carbon dioxide were allowed on the mountain.  A side benefit is the silence from vehicles brought on by this change.

Samso, El Hierro, and Zermatt have given us hope that a move away from all fossil fuels is possible and profitable.  Maybe if we stopped subsidizing the oil companies and put that money toward renewable energy then our country (USA) might be able to lessen it's footprint as well.  As seen in a previous post, Carbon Footprints, we have a very large footprint. Maybe it's time to re-look at our overall energy plan from a long term perspective and move away from mostly fossil fuels like oil and coal which are increasing our carbon output.